Light Rail Now and Walkable Neighborhoods (LRN) can be contacted at: Light Rail Now! |
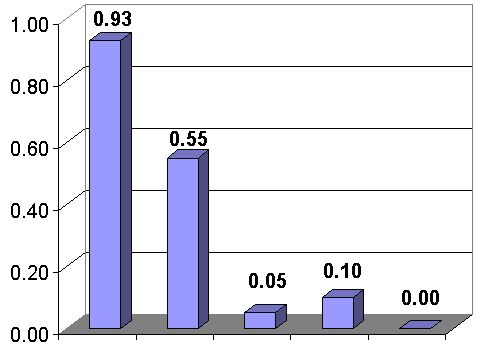
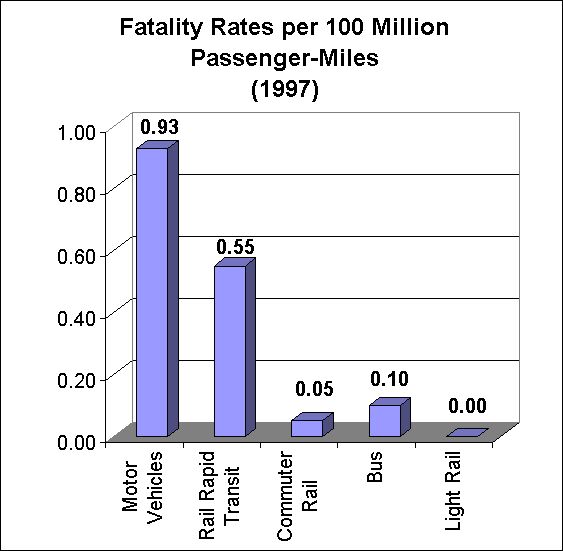
Public transit – particularly light rail – is a very safe and efficient way to travel – certainly, one of the safest modes of urban transportation, and far safer than the automobile. Incredibly, some roadway zealots and spokesmen for roadway industry interests claim that, even with more than 40,000 officially recorded street and highway deaths annually in the USA, the private automobile is somehow safer than mass transit. This fantasy immediately evaporates with any reasonable look at solid statistics, such as the data in the table and graph below for 1997 (the most recent year for which fatality data for all surface modes could be compiled). As these data show, the facts are indeed in line with common sense – public transit is considerably safer than travel by automobile, and light rail transit (LRT) is one of the safest modes of all.
[Source: Bureau of Transportation Statistics/National Transportation Statistics 1999 and FTA/National Transit Statistics and Trends 1998; average motor vehicle occupancy rate of 1.5 calculated from 1998 FHWA data] It doesn't take a rocket scientist to figure out that, with a litany of metro area motor vehicle accidents recited on every single morning radio broadcast in virtually any major American city, the automobile has got to be at the "Darth Vader" end of the safety spectrum. Ah, say the Road Warriors and their anti-transit shock troops, but just looking at the total annual fatality numbers (on a par with US casualties in the Vietnam War) is misleading. Consider the astronomical number of vehicle-miles driven, and the fatality rate doesn't seem as bad. Well, the numbers we're presenting here do show the rate (per 100 million passenger-miles), and they still demonstrate motor vehicles to be a slaughter machine compared with mass transit. But there's another aspect to consider in those astronomical motor vehicle mileage numbers: America's sprawling pattern of development (catering to the automobile) plus the near-obliteration of public transit in past decades have produced an outrageously inefficient mobility system which necessitates going around the moon to get almost anywhere in a US city. it means having to hop in the car (and tally up more miles) just to buy a newspaper or gallon of milk. It requires chalking up many miles travelling hither and yon just to carry out several separate simple tasks. in other words, the automobile-dependent system forces travellers to rack up much of that astronomical vehicle-mileage.
that cost less than $ 200, for example. in Fairfax County, Virginia, for instance, no accident with damages less than $1,000 is reported. in contrast, transit systems must report all injuries plus dubious "injuries" by "ambulance-chasers" (of which there are many). Fatalities are all reported; they can't be hidden. However, most LRT fatalities tend to be not passengers, but individuals in other categories, such as illegal trespassers or motorists violating safety laws or rules. The Federal transit Administration has videotapes of school buses and even police cars trying to beat LRT trains through gate crossings. The FTA is vigorously researching better crossing protection methods, and is currently managing a demonstration project in Los Angeles involving a new second-train warning signal and four-quadrant crossing gates on LACMTA's Blue Line LRT. Accidents involving rail transit passengers should be separated from those involving illegal trespassers, many of whom may be killed or injured on transit tracks because they think tracks are safer for walking than roadways where there are no sidewalks. It should be noted that most fatalities from LRT/automobile collisions tend to be counted as both LRT and highway fatalities (thus, a double-counting). This practice therefore tends to burden LRT with what are essentially roadway fatalities. There are also some irregularities in the reporting of bus vs. LRT accidents. injured bus passengers are not counted as transit accident victims when they are on the sidewalk at the bus stop, or crossing the street to reach the bus stop, but they would be rail casualties if they were on transit property. There appears to be improvement in LRT safety. in California, for example, the general trend is that light rail has been getting even safer. At-grade rail experience, as reported by the California Public Utilities Commission (CPUC) in March 1999, indicates that LRT is relatively safe, especially when compared to other modes of travel. The report found that most accidents occurred due to a collision between a motor vehicle and a train. A study has found that, since 1990, the general trend statewide has been
a drop in the rate of motor vehicle-light rail vehicle accidents. The overall
light rail accident rate dropped by nearly 50% to 1.18 accidents per 100,000 train-miles.
There were 3,494 traffic fatalities in California reported by the National Highway Traffic Safety Administration. The CPUC reported six light rail related fatalities for the same period. 47% of all vehicle-LRV accidents in 1998 were left turn accidents. Motorists making improper left turns in front of light rail trains caused sixty-two accidents in 1998. 51% of all the accidents on the Long Beach LRT line (Blue Line) since July 1990 were the result of vehicles making improper left turns. However, this risk pattern is not specific to LRT, but is entirely consistent with motor vehicle accident experience generally. The CPUC found the second most common cause of motor vehicle-light rail accidents was the problem of motor vehicles running traffic signal lights or going around gates. Vehicles driving around gates have caused nine percent of the Long Beach Blue Line accidents since 1990. As noted above, considerable research is under way aimed at improving grade-crossing and barrier-gate safety. Of the more than 40,000 people per year killed on US roads, about 600 are killed at grade crossings, mostly in collisions with freight trains. Clearly, the fatality rates are much higher for the automobile. There's no doubt about it: The bottom line is that a transit passenger in a bus, LRT car, or train is much safer than a motorist on the "traffic meatgrinder". Much of the material in this report has been adapted from contributions to the Light Rail Progress Professional online discussion list, particularly from Ed Tennyson. Additional material was adapted from the website of the Los Angeles to Pasadena Metro Blue Line Construction Authority. Rev. 2001/03/03 | ||||||||||
|
|
|||||||||||
 And there's another aspect
to this issue: Fatalities tell only a small part of the total story, the total mayhem of
deaths, injuries, and property damage that is now routine for America's prevalent roadway-dependent transportation
system. But the problem is that there's no meaningful system of reporting on these other automobile accidents and injuries. Most US states have limits on accident reporting; some report no accidents
And there's another aspect
to this issue: Fatalities tell only a small part of the total story, the total mayhem of
deaths, injuries, and property damage that is now routine for America's prevalent roadway-dependent transportation
system. But the problem is that there's no meaningful system of reporting on these other automobile accidents and injuries. Most US states have limits on accident reporting; some report no accidents