The Light Rail Now Project can be contacted at: Light Rail Now! |
Proponents of "BRT" (so-called "Bus Rapid Transit"), including the US Federal Transit Administration, assume that, service characteristics (like access time, total travel time, and cost) being equal, the ability of "BRT" service to attract riders is equivalent to that of LRT (light rail transit). Accordingly, the FTA mandates that in ridership forecasting models – such as those commonly used in Major investment Studies for federally funded new starts – bus and rail modes must be treated as virtually indistinguishable to passengers. in fact, speculative ridership models sometimes assign higher trip projections to a "BRT" system alternative, on the basis of input assumptions of supposed bus "flexibility", such as neighborhood access, "seamless", transfer-free trips, express services leapfrogging around local services, etc. But do these theoretical projections jibe with reality? The empirical evidence would appear to suggest otherwise. Recent experience with new LRT starts, in comparison with new "BRT" starts, certainly does not suggest that the two modes are equally attractive. More and more, new LRT systems (as in Denver, Salt Lake City, Dallas, St. Louis) are finding themselves flooded – overhwelmed, in some cases – with passengers. (See "Light Rail's Besieged With Riders! This is a Problem?" and "Light Rail's Stunning Track Record in Meeting – and Exceeding – Ridership Projections".) But where are the crowds besieging the latest "BRT" installations – like Pittsburgh's West Busway and Los Angeles's Harbor Transitway? An historical review of major "BRT" experiences in North America – particularly in comparison with rail transit – provides some anecdotal indications of both the relative passenger-attractiveness of the two modes as well as other operating characteristics. While these cases are not presented as conclusive "scientific" evidence, at the very least they suggest a pattern which planners and decisionmakers would do well to consider. • 1967 – in suburban Philadelphia, the conversion of the Ardmore electric trolley (LRT)
line to a busway resulted in a 15 percent loss of ridership and an increase in operations
and maintenance (O&M) costs (due to the need for more buses to carry fewer people).
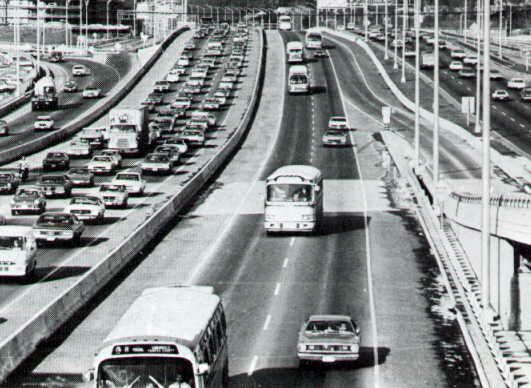
• 1973 – The El Monte Busway in suburban Los Angeles, installed on a former interurban
railway alignment in the median of I-10, has been moderately successful, peaking with a ridership of about 30,000 per day. However, influential planners, highway engineers,
and political leaders, perceiving unused capacity between the buses, in the 1980s opened the facility up to use by car pools. With the buses now delayed by "HOV"
automobile traffic, ridership has dropped to about 20,000, a reduction of 33 percent.
Meanwhile, a commuter rail line constructed by California down the middle of the "BRT" alignment, implemented to speed person-movement in the corridor, has been quite successful - consistently gaining ridership.
• 1983 – Pittsburgh's East Busway originally projected
80,000 weekday rider-trips, but the actual service initially attracted only about 30,000.
The system lost 25 percent of bus riders as the busways developed.
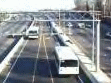
• 1997-2000 – Los Angeles's Harbor Transitway, with busway stations, cost
approximately $500 million for ten miles of route. Originally projected to attract 63,000
weekday rider-trips, the service has actually attracted only about 5,000. The roughly
parallel Blue Line LRT service, miles to the east, recently reached a ridership level of
70,000 per day. in terms of cost-effectiveness, the "BRT" has been virtually an
economic disaster. The transit agency and political leaders have been trying to bolster
ridership by cutting the "BRT" fare in half and adding service, but to date there has been
no clear improvement. Meanwhile, bus load factors appear to be significantly lower than
those of LRT; the average bus in LA has 15 passengers averaged over the length of its run, compared to 38 for LRT. • 1999-2000 – Pittsburgh's West Busway, with a capital cost of approximately $55 million
per mile, was originally projected to attract 50,000 weekday rider-trips. However, initial ridership of only 5,400 has grown modestly to 9,000 (18% of projections),as repairs to a parallel bridge in the corridor have delayed motor vehicle traffic and
given a temporary ostensible advantage to the busway. It is debatable whether this level of ridership will be maintained after bridge repairs are completed, and traffic delays are thus eliminated.
Taken as a whole, Pittsburgh's three busways were forecast to
attract 165,000 weekday rider-trips. in reality, only 55,000 daily rider-trips have actually
materialized some 25 years from the opening of the first busway there.
Altogether, analysis has shown that, for new starts installed in corridors serving the core areas of US cities, "BRT" busways have attracted only one-third of the rider-trips estimated for them by FTA-approved modelling. LRT has attracted 122 percent. The palpable effect of this is that, on most new LRT systems, parking lots are jammed, and riders are crowding on trains; in contrast, typical new "BRT" systems may experience modest increases in ridership, but certainly not the avalanche of passengers seen on LRT.
Does this suggest a pattern? Certainly, what it does suggest, in light of experience with both LRT and so-called "BRT", is that theory-based ridership forecasting models, approved by an FTA promoting "BRT", may not tell planners, decisionmakers, and the public the whole story. For information and analysis used in this report, Light Rail Progress particularly wishes to express appreciation to Ed Tennyson, PE. Photo of Denver LRT by Jon Bell. Updated 2005/11/10 |
|
|
|
 • 1970-1996 – in the Northern Virginia suburbs of
Washington, DC, the Shirley Busway was deemed a great success upon its opening in 1970. The pre-existing Route
18 was expanded from three trips per day (without subsidy) to approximately thirty trips with subsidy – yielding a substantial increase in ridership.
However, with long gaps between buses, political pressure grew to convert the busway into an HOV lane,
opening it up for use by automobiles. Ridership peaked in 1980-81 during the second energy crisis. Subsequently it declined 67% as costs
increased sharply. At the same time, transit ridership in the National Capital area ballooned from 135 million per year to 270 million, mainly because of the introduction of
the MetroRail system. in 1996, ridership on the Route 18 Shirley Busway buses had plunged to 2,350 weekday rider-trips. As MetroRail service was introduced to the Route
18 territory (Springfield, Va), bus ridership dropped further to 1,650 per day; however, MetroRail patronage in Springfield soared to 13,000, even though bus fares were lower
than rail and travel time was approximately equal. Furthermore, the operating cost of rail transit was far less per passenger.
• 1970-1996 – in the Northern Virginia suburbs of
Washington, DC, the Shirley Busway was deemed a great success upon its opening in 1970. The pre-existing Route
18 was expanded from three trips per day (without subsidy) to approximately thirty trips with subsidy – yielding a substantial increase in ridership.
However, with long gaps between buses, political pressure grew to convert the busway into an HOV lane,
opening it up for use by automobiles. Ridership peaked in 1980-81 during the second energy crisis. Subsequently it declined 67% as costs
increased sharply. At the same time, transit ridership in the National Capital area ballooned from 135 million per year to 270 million, mainly because of the introduction of
the MetroRail system. in 1996, ridership on the Route 18 Shirley Busway buses had plunged to 2,350 weekday rider-trips. As MetroRail service was introduced to the Route
18 territory (Springfield, Va), bus ridership dropped further to 1,650 per day; however, MetroRail patronage in Springfield soared to 13,000, even though bus fares were lower
than rail and travel time was approximately equal. Furthermore, the operating cost of rail transit was far less per passenger. • 1978 – Pittsburgh's South Busway, projected to carry
35,000 weekday rider-trips, actually attracted only 20,000 rider-trips initially, and that level has now dropped to
about 14,500, less than pre-busway ridership in the affected corridor. Meanwhile, a parallel LRT upgrade has
attracted approximately fifty percent more passengers.
• 1978 – Pittsburgh's South Busway, projected to carry
35,000 weekday rider-trips, actually attracted only 20,000 rider-trips initially, and that level has now dropped to
about 14,500, less than pre-busway ridership in the affected corridor. Meanwhile, a parallel LRT upgrade has
attracted approximately fifty percent more passengers. • 1986-2002 – Ottawa, despite vigorous busway development, has lost over ten percent of its transit system riders despite the $450 million "BRT" investment.
Fares initially were raised over $2.00, but have since been reduced in an effort to gain riders – but at the cost of a significant loss of revenue.
• 1986-2002 – Ottawa, despite vigorous busway development, has lost over ten percent of its transit system riders despite the $450 million "BRT" investment.
Fares initially were raised over $2.00, but have since been reduced in an effort to gain riders – but at the cost of a significant loss of revenue.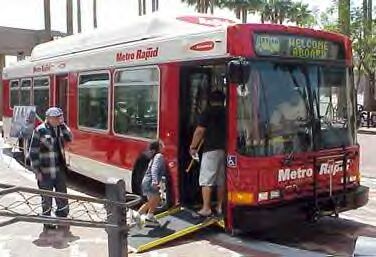 • 2000-2002 – Los Angeles's Wilshire and Ventura Metro Rapid Bus services, while operating in mixed traffic and
not in busways, have nevertheless been frequently and widely cited as examples of "BRT" success, largely on the
basis of an increase in bus ridership in the affected corridors. The new "BRT" services offer about 25% faster
service (now averaging about 15 mph) by much wider spacing of stations (0.85 mile), modification of traffic
signals to extend green time for buses, and consolidation of routes to eliminate transfers. in addition, new, lowfloor CNG buses and modern,
attractive stations have been introduced. However, many questions remain as to exactly
how much of the apparent increase in corridor ridership is attributable to the "BRT"
improvements, and how much to normal traffic increase for the local bus services. With
an initial 80,000 riders per day, the Wilshire corridor already had one of the highest bus
riderships in the world, which is said to have now increased to 90,000, or about 13%
(compared with 18,000 in the Ventura corridor). Furthermore, both the Wilshire and
Ventura "BRT" routes were opened concomitantly with the new Red Line metro rail
subway extension, and serve as feeders to it, thus clouding the picture as to how much
new patronage is actually due to the "BRT" attributes. in contrast, LA's Blue Line LRT
has recently exceeded 70,000 boardings per day, although, when planned, it was estimated to peak at 50,000.
• 2000-2002 – Los Angeles's Wilshire and Ventura Metro Rapid Bus services, while operating in mixed traffic and
not in busways, have nevertheless been frequently and widely cited as examples of "BRT" success, largely on the
basis of an increase in bus ridership in the affected corridors. The new "BRT" services offer about 25% faster
service (now averaging about 15 mph) by much wider spacing of stations (0.85 mile), modification of traffic
signals to extend green time for buses, and consolidation of routes to eliminate transfers. in addition, new, lowfloor CNG buses and modern,
attractive stations have been introduced. However, many questions remain as to exactly
how much of the apparent increase in corridor ridership is attributable to the "BRT"
improvements, and how much to normal traffic increase for the local bus services. With
an initial 80,000 riders per day, the Wilshire corridor already had one of the highest bus
riderships in the world, which is said to have now increased to 90,000, or about 13%
(compared with 18,000 in the Ventura corridor). Furthermore, both the Wilshire and
Ventura "BRT" routes were opened concomitantly with the new Red Line metro rail
subway extension, and serve as feeders to it, thus clouding the picture as to how much
new patronage is actually due to the "BRT" attributes. in contrast, LA's Blue Line LRT
has recently exceeded 70,000 boardings per day, although, when planned, it was estimated to peak at 50,000.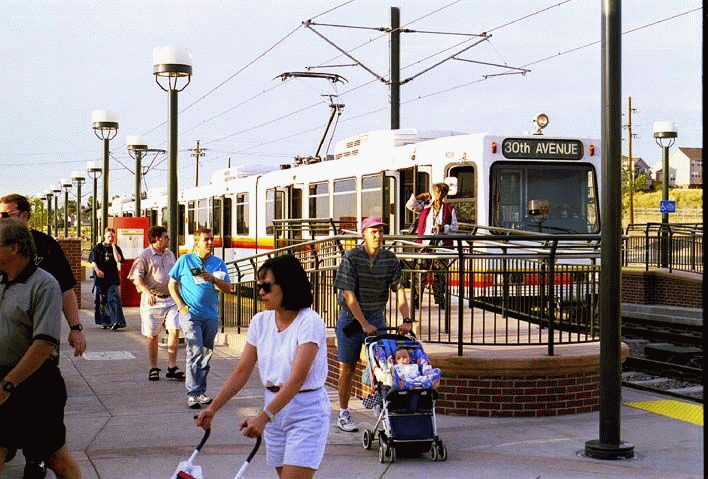 in an article describing how Denver's new
LRT extension was overwhelmed with passengers, a Denver Business Journal
reporter assured readers that "Packed light-rail cars, overflowing parking lots and
passengers left behind on station platforms aren't unique to the Regional
Transportation District's new Southwest light-rail line." On the contrary, "They are
scenes repeated around the country as people flock to new rail transit lines in numbers far beyond initial projections."
in an article describing how Denver's new
LRT extension was overwhelmed with passengers, a Denver Business Journal
reporter assured readers that "Packed light-rail cars, overflowing parking lots and
passengers left behind on station platforms aren't unique to the Regional
Transportation District's new Southwest light-rail line." On the contrary, "They are
scenes repeated around the country as people flock to new rail transit lines in numbers far beyond initial projections."