
Light Rail Now/Light Rail Progress can be contacted at: Light Rail Now! |
In September 2001, the US General Accounting Office, at the behest of several congressional representatives, issued a report titled "Mass Transit: Bus Rapid Transit Shows Promise" (GAO-01-984). Purportedly a comparative "study" of light rail transit (LRT) vs. so-called "bus rapid transit" (BRT), the GAO report has sparked widespread controversy and criticism for what many professional critics say is an amalgam of misinformation, factual errors, serious anomalies, and highly questionable data sources in many instances. The GAO report was performed at the behest of several key rightwing Republican leaders in the US House of Representatives. These included: · Rep. Tom DeLay (Texas) – Republican Majority Whip. A quintessential Road Warrior from a Houston-area suburb, DeLay has played a pivotal role in roadblocking federal funding of Houston's LRT project (which has proceeded with local funding nonetheless). He has maintained a close association with the far-right Texas Public Policy Foundation, a "think tank" (actually, propaganda mill) which has played a front-line role in boosting highway expansions and opposing major transit projects around the state. in the spring of 2000, DeLay was keynote speaker at the TPPF's annual dinner. He is currently a key member of Gulf Coast Regional Mobility Partners, a coalition of "elected officials and business representatives" lobbying for accelerated highway expansion in the Houston area. · Rep. Don Young (Alaska) – Chairman, Committee on Transportation and infrastructure. Young has been a leading proponent of more Alaskan oil drilling, including in the Alaskan National Wildlife Refuge. · Rep. Thomas Petri (Wisconsin) – Chairman, Subcommittee on Highways and Transit, Committee on Transportation and infrastructure. Petri's website boasts that "important Petri legislative initiatives" have included "the allocation of money for federal highway spending" and that "Rep. Petri has been the key person responsible for winning a fair share of federal highway dollars for Wisconsin's roads." · Rep. Tom Tancredo (Colorado) – Tancredo, whose website includes links to favored sites such as pro-highway, anti-transit "think tanks" like the Cato institute and the Colorado-based independence institute, nevertheless is by far the most moderate of the group, judging by his public support for Denver's LRT projects. It should be noted that much of the "data" included in the GAO report has been proven to be faulty, and the report must be regarded as highly controversial and not accepted as reliable by a consensus within the transportation planning profession. Given the GAO study's heavy pro-highway, rubber-tire-oriented origin and lineage, it is hardly surprising that the report has evoked substantial skepticism and criticism from public transit proponents, and particularly those who see a major role for LRT. The following analysis of the report was presented to a meeting of the Transportation Research Board Comittee A1E12, Light Rail, in January 2002, by Edson L. Tennyson, P.E., a transportation consultant and former deputy secretary of transportation for the State of Pennsylvania. it has been slightly edited for publication here.
Analysis of the General Accounting Office Report "Bus Rapid Transit Shows Promise" By Edson L. Tennyson, P.E. GAO – introduction: "The Federal Transit Administration (FTA) has begun to support the [bus] concept and expand awareness of new ways to design and operate high capacity Bus Rapid Transit (BRT) systems as an alternative to building Light Rail systems." GAO – Purpose: "To examine the federal role in supporting BRT; compare the capital costs, operating costs and performance characteristics; and describe other advantages and disadvantages of BRT and LRT." GAO – Method: "We interviewed FTA officials and industry experts to identify the advantages and disadvantages of BRT and LRT." Comment: The "experts" are never identified but some support LRT as far more acceptable to the public and others suggest erroneous and disproven advantages of BRT. GAO – Cost: "Two BRT projects have received funding commitments from the current New Starts program totalling about $ 831 million."
GAO – Public Preference: "Transit officials repeatedly noted that buses have a poor public image...." Comment: The report also notes that "Los Angeles and Houston originally built part of their [BRT] systems as exclusive busways and later converted them to HOV [High Occupancy Vehicle – automobile and bus] facilities." (Northern Virginia could be added to this list.) Politicians perceived too little use of the costly busways, but with HOV in Los Angeles, buses were delayed and lost much patronage until HOV rules were made more restrictive. In Northern Virginia, HOV rules are occasionally suspended and bus movement stops or is severely delayed, making second trips of the bus impossible. GAO – Misinformation: "The reason for the relatively few BRT projects being ready for funding .... Includes the newness of BRT." Correction: BRT is hardly "new". The first known BRT operation was in 1938 in Newark, New Jersey's Cedar Street subway. Service was discontinued after gasoline rationing ended. The second known BRT was the Ardmore Route 103 of Philadelphia Suburban Transportation Co., converted in 1967 from LRT Costs of operation increased and 15 percent of the passengers were lost. Northern Virginia opened their BRT in 1970 and has lost riders ever since the energy crisis of 1980, now down about 67 percent. Pittsburgh's first BRT was in 1977, before any new LRT starts in the USA. Planners promised 32,000 weekday passengers but the service now averages 14,500. GAO - Policy: "FTA promotes the BRT concept with the slogan 'think rail, use buses'." Correction: The implication that buses provide equivalent attributes or advantages to those of rail transit, and at lower cost, is deceptive. The GAO report's Figure 6 shows average BRT (construction) cost at $13.49 million per mile, but this involves the simple marking of street lanes for 12 mile an hour service, not really BRT. See the discussion of 'Cost' above, which notes the cost of recent busways at $55 or $83 million per mile. Conversely, GAO's purported LRT "average" of $34.8 million per mile includes some subway or tunnel construction which was omitted from the BRT average cost. GAO – Misinformation: "In Pittsburgh they needed to construct only five [5] miles of busway to achieve the goal of rapid transit to the airport because the buses could exit the busway and use existing highways." The report adds that an alternative for light rail would have been longer, "cost two to three times as much to construct and equip for operation without attracting any significant added patronage."
The Buffalo subway was used for LRT costing without a detailed study, but the Pittsburgh project was on abandoned railroad right-of -way. A current LRT project in Pittsburgh is costing about $325 million for five miles of very costly hillside construction, but with subway access to downtown. The West BRT was estimated to attract 50,000 weekday passengers but so far has attracted about 6,000. An independent estimate for rail operation forecast 20,000 weekday passengers. GAO – False Statement: "We also attempted to determine operating cost per passenger-mile as a measure of comparison, however we could not obtain sufficient data for such an analysis". Comment: FTA has required passenger-mile data at least since 1982. GAO reported the cost per hour was $84.72 on its selected bus systems and $161.48 on LRT systems in the same cities. GAO also reported buses may carry fifty passengers and LRT 110. Actual capacity is greater but these numbers are realistic (6.8 square feet per passenger average). Thus the bus cost per passenger for an hour ride is $1.69 and the LRT cost is $1.47 for the same trip. if the average speed is 15 miles per hour, and passengers ride the full route length, the cost per passenger-mile would be 11.3 cents by bus and 9.8 cents by rail. However, actual passengers seldom ride the full length of the route, so the passenger-miles must be cut in half, raising the bus cost to 22.6 cents and LRT to 19.6 cents per passenger-mile. The actual cost of express buses in Dallas was 46 cents per passenger-mile, the only city where the data were segregated out. in San Diego and Saint Louis (and Calgary in Canada) LRT cost was 18.5 cents per passenger-mile in 1998. Did GAO avoid these well-performing systems on purpose? Dallas express buses are contracted out to lower-labor-cost operators, so their costs cannot fairly be compared to LRT there. Articulated buses could not be compared for lack of data, but an operations research study of actual operations in Los Angeles found that articulated buses cost more per passenger than standard buses because of slower operation, and higher maintenance and safety costs. Erroneous Data: GAO's Figure 7 is replete with errors. Los Angeles's cost per bus hour is not $56 but $93.72, according to FTA in 1998. LRT in L.A. is not $434 per hour, but $253.94. This invalidates the GAO findings. The GAO report's Figure 8 also contains several errors involving the cost per mile of operation. The Dallas GAO cost of $1.74 for buses was published by FTA as $7.24, or $3.48 for the express buses with higher speed and lower labor cost. The cost per mile varies inversely with speed. Denver's bus cost per mile was said by GAO to be $2.24, but FTA reports $5.10. Denver has many long, fast routes. GAO reported Los Angeles at $3.45 per mile, but FTA's published figure was $8.01. LRT costs related by the GAO report were generally correct. it is possible staffers gave GAO their estimate of "avoidable' or incremental costs whereas FTA reports the full cost. GAO Figure 9 is similarly erroneous. Dallas bus trips do not cost 31 cents as stated, but $3.19 local and $3.68 express. Perhaps a decimal point was misplaced. Denver cost $2.38, not $1.21 as reported. Los Angeles was $1.72, not $1.06. Here, too, we may be seeing avoidable costs, not full costs. Ridership: GAO found that "the largest ridership on BRT and LRT is quite similar. Busways averaged about 15,000 riders per day" but "LRT system ridership ... averaged about 29,000 per [week]day.' There is no way 15,000 is "quite similar" to 29,000. in the Los Angeles CBD at rush hour, ridership on the street averages 32,500 per day, but it is a fact that the "weak" LRT Green Line averages 33,000, nowhere near the CBD, and the Blue LRT Line to the CBD averages well over 63,000. That is why "transit officials" told GAO that passengers prefer rail. Speed: The GAO report's Figure 10 shows a 56-mile-an-hour BRT speed, but that must be without any stops for passengers. LRT is listed at 16 miles per hour which is realistic for the slower lines with the most stops and 36,727 weekday passengers. However, that speed includes the turn-around time at each terminus; the actual schedule speed is about 20 mph. The Dallas express bus system averaged 17 miles per hour in 1998 with many routes in all directions, but carried only 31,464 weekday passengers. There are only two LRT routes in Dallas, but they attract more passengers. Denver received the most distorted portrayal by the GAO study, with LRT being reported at only 11 miles per hour. This was for the downtown segment of the route. The full route speed is 23 miles per hour. The bus speed of 35 miles per hour applies to the isolated freeway portion of the route. The entire Los Angeles Green LRT Line also averages 35 miles per hour, with stops, for 33,000 weekday passengers. Rail cars have faster acceleration than bus, particularly on grades, where bus drivers sometimes turn off the air-conditioning to avoid very slow operation. This is not a problem with electric rail. In Northern Virginia, the Shirley HOV-Busway is non-stop, but when off-line stops are added, the speed falls to 22 miles per hour, about the same as the schedule speed of many LRT lines. However, the Shirley service attracted only 12,868 weekday passengers in 1992, with losses since then. LRT averages about the same on suburban lines, but with far more patronage. Most BRT lines have limited or no weekend service for lack of demand. Flexibility: GAO correctly reports that BRT excels in this attribute, but does not explain that passengers do not respond well to flexibility as noted above. The fixed right-of-way is an advantage that experience has clearly proven. Gradual Phase-in of BRT: This purported "advantage" is claimed by GAO, but this is in reality a great disadvantage for passengers who are the purpose of the service. Benefits and savings are ignored. Negative Busway Attributes: GAO admits that buses are not popular with the public, "particularly when compared to rail service." GAO seems to assume that buses can be made popular by calling them BRT. GAO ignores real-time experience.
Many LRT passengers avoid transferring by driving to park-and-ride facilities. Buses do not attract such riders at the same rate, but they do attract some of them. in Cleveland, Detroit, and Saint Louis, extensive freeway express bus service has been decimated, eliminated on many routes, but LRT has done very well, and at much lower operating cost per passenger-mile, except in Detroit where there is no LRT. Detroit's Pdpwntown People Mover (an automated guideway transit system) is very high cost, with low ridership, despite its exclusive guideway. Light Rail Advantages: These are largely passed over by GAO. While conceding the economic development advantages, no mention is made of travel safety whereby bus service experiences 80 percent more injuries per million passenger-miles. The lack of LRT air pollution is not mentioned, nor are labor savings with train operation. The GAO report does not explain why the West Busway in Pittsburgh, the Harbor Freeway Transitway in Los Angeles, and the Seattle bus tunnel are omitted from the report's data, other than to say the West Busway is too new. That did not stop the authors from touting the advantages of unbuilt systems. These three facilities cost $1.2 billion to build to cover 18 miles, $67 million per mile with only 34,000 total weekday passengers on all three. The L.A. and Pittsburgh projects have attracted only 9,000 total weekday passengers combined, but 113,000 were promised. Why was this not reported? Updated 2002/12/22 |
|
|
|
 Comment
 Comment
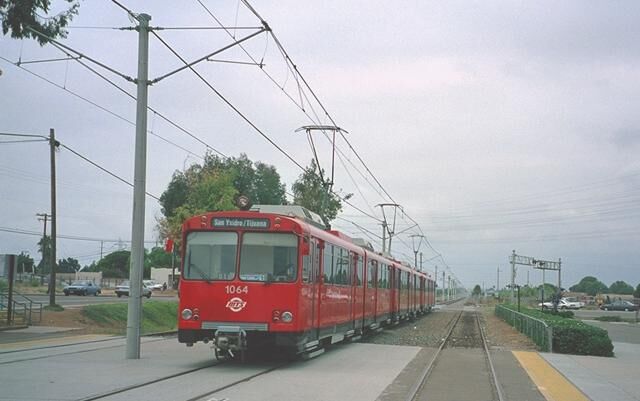 For example, when the local trolley
service (see photo at right) replaced San Diego Express Bus Route 90 on freeway 94, ridership
increased from 3,000 per weekday to 12,000 east of Euclid Avenue.
Protests about the switch to local service were soon forgotten. When Denver replaced express bus service on Santa Fe Drive (US 85)
with all-stop LRT service, ridership more than doubled and weekend service became economical.
For example, when the local trolley
service (see photo at right) replaced San Diego Express Bus Route 90 on freeway 94, ridership
increased from 3,000 per weekday to 12,000 east of Euclid Avenue.
Protests about the switch to local service were soon forgotten. When Denver replaced express bus service on Santa Fe Drive (US 85)
with all-stop LRT service, ridership more than doubled and weekend service became economical.