Light Rail Now and Walkable Neighborhoods (LRN) can be contacted at: Light Rail Now! |
Not well at all, if you would believe the claims of many light rail opponents, who concoct an image of slow-moving "trolley cars" dawdling along from transit stop to stop. in one of his familiar boilerplate tracts, the pre-eminent Road Warrior ideologue Wendell Cox explains "Why Light Rail Won't Work for San Antonio" (Texas Public Policy Foundation, January 2000):
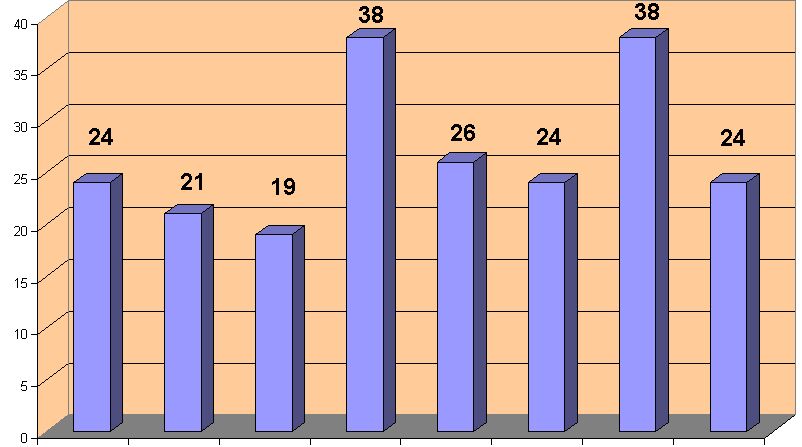
This same "slow speed" Old Wives' Tale is picked up and re-articulated in a variety of forms by anti-rail zealots across the country. During the fiercely fought light rail campaign in Austin, Texas in 2000, for example, the anti-transit highway-boosting group ROAD (Reclaim Our Allocated Dollars) asserted that "light rail trolley cars travel at an average speed less than 17 miles per hour ...." indeed, during the campaign, some ROAD zealots preached that LRT "trolleycars" would plod through Austin no faster than 9 mph! According to opponents' rhetoric, LRT just seems to be going slower ... and slower ... and ... So what's the real lowdown on the LRT "slowdown"? Supporters of improved urban mobility can take heart in the fact that the reality is not at odds with what common sense tells them – LRT really is a relatively fast mode of urban transportation, especially for public transit. As the table and chart below indicate, modern light rail systems have average speeds in the range of 20 mph or faster. This is faster than local street bus speeds of 12-13 mph, and competitive with the average speeds of automobiles -- 23-25 mph in urban traffic conditions (a mix of freeways, arterials, and local streets).
Sources: Calculated from schedule and route It should be kept in mind that these are average schedule speeds including station stops to board and let off passengers. They may also reflect speed restrictions, such as in streets or arterials, and relatively slow progress through central areas with frequent stops. The more sophisticated LRT opponents often base their low-balled "average speed" values on average operating speeds reported by the Federal Transit Administration (FTA) in its National Transportation Data Base (NTDB). The problem with the NTDB data, however, is that it includes vehicle (or train) layover time at the ends of routes – a delay not experienced by passengers. The data we have presented are calculated from actual schedule times and route lengths provided by the various transit agencies, and reflects the actual average travel speeds LRT passengers truly experience. Also, the FTA "national average" data opponents typically quote includes the much slower speeds of older streetcar-type LRT operations in cities like Boston, San Francisco, and Philadelphia. This tends to skew the national average speed downward. Opponents also frequently confuse their audience by playing "mix-and-match" games with average schedule speed and maximum speed, to concoct an image of "slow" LRT trains crawling at 17 or 20 mph, vs. speedy cars and buses on freeways blazing past at 55 mph. in reality, LRT maximum speeds in public thoroughfares are typically the same as the posted traffic speed (often ranging from 25 to 50 mph) and up to 50-55 mph on highspeed (usually exclusive) sections of alignment, like railroad corridors. This potential for highspeed operation is reflected in the amazingly high average speeds (nearly 40 mph, including station stops) achieved by Los Angeles's Green Line and a major segment of the newly completed Littleton LRT line in Denver. 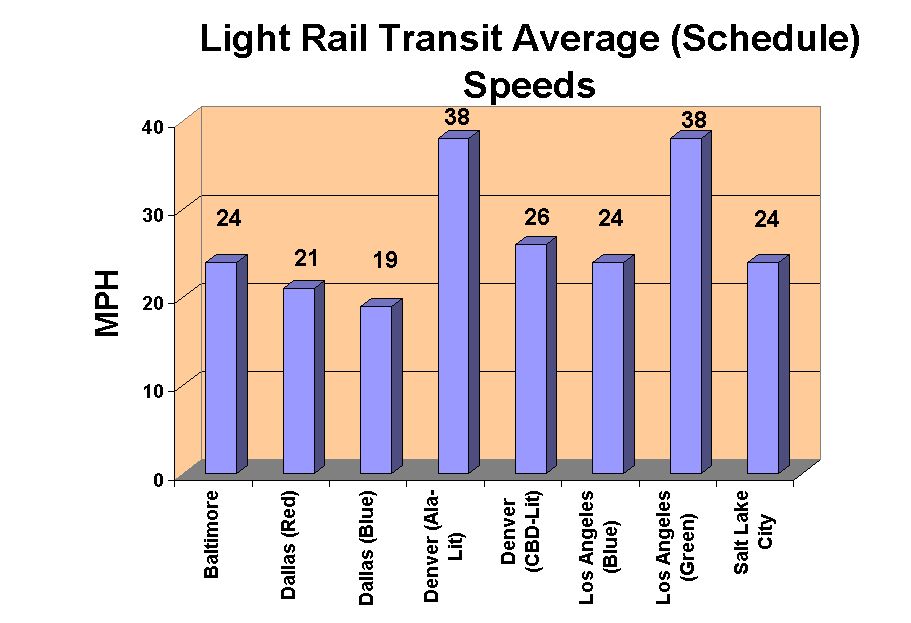 Note that this analysis is not comprehensive – we've selected only fairly new LRT lines, and only those for which the pertinent data to calculate average speeds were relatively easy to obtain. Nevertheless, we believe these lines are reasonably representative of new LRT operations, and these real-world data effectively debunk the myth that LRT is "slow". Light Rail Progress Rev. 2001/03/24
|
| |||||||||||||||||||
 it's no secret that one of the
primary justifications for installing light rail transit (LRT) is to improve the speed of transit
service – to provide a faster ride for transit passengers and a transit alternative more
competitive with the private automobile. How well do new LRT systems meet this goal?
it's no secret that one of the
primary justifications for installing light rail transit (LRT) is to improve the speed of transit
service – to provide a faster ride for transit passengers and a transit alternative more
competitive with the private automobile. How well do new LRT systems meet this goal?