The Light Rail Now Project can be contacted at: Light Rail Now! |
Revised Analysis by Light Rail Now Project Team • April 2007 NOTE: The analysis now presented here is an additional revision of an earlier Light Rail Progress analysis that had originally been performed in April 2001. While some assumptions have changed in light of subsequently available data, the basic comparison of Blue Line light rail transit service with hypothetically alternative bus service, and the overall conclusion, remain consistent. For more detailed discussion, see the explanation in the Methodology section. One of the most important advantages of light rail transit (LRT) is its propensity to lower operating costs – a key reason why this mode is such an attractive choice compared to various bus service alternatives. As numerous studies have demonstrated, LRT typically tends to be much cheaper to operate than comparable bus service, especially for higher passenger volumes, since LRT tends to attract more passengers than buses, for a given level of service, and then to provide increased capacity more cost-effectively to transport those passengers expeditiously, safely, and comfortably. A primary reason why light rail costs tend to be lower is that LRT vehicles provide more passenger space and, in addition, can be coupled in trains, usually between 2 and 4 cars in length. This typically means that only a single train operator is required instead of many bus drivers – a significant cost advantage over the need for a driver for every bus. LA's Blue Line corridor
Critics frequently argue that ordinary bus service would be a cheaper alternative for this corridor – such as the Metropolitan Transit Authority's Line 60 bus route, which roughly parallels the Blue Line, using surface streets.
Current analysis: 2-car trains So what would it cost for a surface bus to carry the entire ridership volume of the Blue Line? It is extremely unlikely that surface bus service alone would attract such a ridership level in that specific corridor; however, using available data, mainly from the Los Angeles County MTA (LACMTA), we've developed a reasonably accurate comparative analysis with the assumption of equivalent ridership. For simplicity, we've confined the analysis to operating costs for a single weekday, using the operating hours specified in current schedules. We first ran a comparison based on the Blue Line's current use of 2-car trains. The basic results are summarized in the graph below.
It can be seen that, even under current [April 2001] operating conditions with maximum 2-car trains (limited by platform lengths), an alternative surface bus system would incur operating costs about 65% higher than those of LRT. Because of lower bus vehicle capacities, lower speeds, and longer running times, to provide the capacity (at assumed comfort loadings) to handle the current [2001] 56,225 riders, the alternative bus service would require a maximum of approximately 170 peak buses; during each peak hour, this would mean a bus running about every 45 seconds in each direction over the route. Projected costs with 3-car trains However, LRT's costs may go even lower, as LACMTA is currently reconstructing stations to handle 3-car trains. [NOTE: The Blue Line now uses both 3-car and 2-car trains.] Assuming the use of 3-car trains (alternating with 2-car trains), we ran a projected comparison of the impact on operating costs, summarized in the graph below.
From the graph above, it can be seen that the use of 3-car trains will lower LRT already low operating costs dramatically – to about 58% of comparable surface bus service. In other words, serving the Blue Line route by surface buses would incur operating costs approximately 74% higher than with the 3-car trains expected [in 2001] to be deployed in this service.
LACMTA does not provide a breakout of operating costs for individual lines, so we used data and assumptions based on LACMTA information.
The analysis now presented here is an additional revision of an original Light Rail Progress analysis that had been performed in April 2001 (with information available at the time) to assist Los Angeles transit advocates and planning professionals involved in estimating the suitability of LRT vs. "BRT" in LA's Exposition Blvd. corridor. While it was based on some operational data and estimated from LACMTA data for Fiscal Year 2000, it necessarily included an array of assumptions and professional "guesstimates" because critical data – such as the Year 2000 National Transit Database (NTD) data – were not available (or accessible) at the time. Thus, although the LRP analysis was broadly accurate in its conclusions (especially in establishing a relationship between Blue Line LRT and parallel Route 60 bus operations and costs) it included a number of approximations, educated guesses, and other "soft areas" which subsquently made it vulnerable to criticism – especially from transit critics and opponents of rail development – in light of more recent and available data. Blue Line critics at the time of the original analysis (2001) were claiming that it would have been much cheaper if the parallel Route 60 local bus service (linking the LA CBD with Long Beach, like the BLue Line) were carrying the Blue Line's 56,200 daily rider-trips, instead of LRT. To counteract this argument, LA-area transit advocates wanted to demonstrate, in particular, that the Blue Line was saving operating & maintenance (O&M) costs in comparison to costs that the Route 60 bus line would incur to carry a similar ridership. The LRP team used immediately available data (including some provided by LA transit advocates and contacts in LACMTA) to estimate what the O&M costs of providing "equivalent" ridership capacity "at assumed comfort loadings" comparable to those of the LRT. Of necessity, these estimates were as accurate as possible within available data, but nevertheless rough. For example, one of the most vulnerable aspects was the original estimate of the peak bus fleet, apparently based on the commonly used "10% of daily ridership" rule as an approximation of passenger volume in the peak hour, peak direction (passengers per peak hour per peak direction, pphpd). With the total fleet required in both directions, this produced a figure of just over 200 buses, which subsequently available operating data suggest is somewhat excessive. However, it also became clear that a simple extrapolation of Route 60 ridership and assigned fleet (in 2001, Route 60 was carrying about 26,700 daily rider-trips with a maximum of about 37 peak buses) was insufficient to provide anything approaching service comparable to the Blue Line LRT and attracting its ridership. In reviewing the assumptions underlying the original analysis – assisted by a broader base of data than were available to the LRP team in 2001 – the Light Rail Now Project team have revised operational scenarios not only for the bus alternative but also for the two LRT alternatives (the comparison was made with LRT running both the then-current 2-car trains as well as the then-proposed 3-car trains). It's important to keep in mind that the Blue Line LRT attracted approximately 40,000 additional daily riders over the ridership that had been diverted from Route 60 and other bus services. (Route 60 itself was carrying about 30,000 rider-trips before Blue Line LRT was launched.) There cannot be any real parity between a local bus service and LRT, especially in speed; however, where some "parity" could be approximated, as in interior space, passenger comfort, and passenger security, this assumption was incorporated. it is simply untenable, as some rail critics do, to merely "inflate" the existing Route 60 operating and cost data commensurate with an "inflation" of assumed ridership. Perhaps this could happen if Route 60 had been slowly gaining ridership, but it would not reflect all the additional riders attracted relatively suddenly to the Blue Line; furthermore, prior to the opening of Blue Line service, Route 60 had been losing, not gaining, ridership. Operating assumptions and cost projections as a result of this analysis are presented below. General Assumptions All operating parameters and costs relate to Fiscal Year 2000.
Passenger Volumes Passenger volumes for various daily periods were estimated from train consist information, schedule information, and other sources. A "passenger" actually means a rider-trip or boarding.
Operational Assumptions Like passenger volumes, operational scenarios were developed from train consist information, schedule information, and other sources, as well as the passenger volumes.
Estimated O&M Costs Based on the assumed comparable operating scenarios, and incorporating the unit cost data available from LACMTA, total O&M costs for each mode were projected. Total costs were rounded up to the nearest $100 to be roughly consistent with the level of accuracy.
Some information in this report has been adapted from material provided by contributors to the Light Rail Progress Professional online discussion list. Rev. 2007/04/28 |
|
|
|
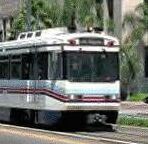
 An example of this cost-saving
capability in action can be seen in the case of Los Angeles's Blue Line LRT
service, a 22-mile route between central LA and Long Beach. Ridership on the Blue Line has climbed steadily,
far exceeding previous ridership in the corridor (and connecting bus services have benefited as well).
Currently, 56,225 daily riders are served by 20 peak morning trains, 10 offpeak-period trains, and 19 peak afternoon trains (all 2-car).
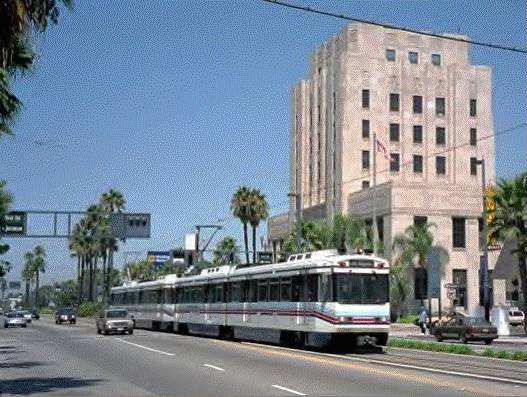
An example of this cost-saving
capability in action can be seen in the case of Los Angeles's Blue Line LRT
service, a 22-mile route between central LA and Long Beach. Ridership on the Blue Line has climbed steadily,
far exceeding previous ridership in the corridor (and connecting bus services have benefited as well).
Currently, 56,225 daily riders are served by 20 peak morning trains, 10 offpeak-period trains, and 19 peak afternoon trains (all 2-car).
 The 2 services are different in many other respects, and Line 60 carries an average of only 26,694 daily (weekday) riders compared with the 56,225 a day on the Blue Line LRT.
It should be noted that Line 60 partly acts as a feeder to the Blue Line, so its ridership is undoubtedly partly a function of ridership attracted to the Blue Line and its high level of service.
Line 60 currently [2001] requires a total of 115 daily bus-trips.
The 2 services are different in many other respects, and Line 60 carries an average of only 26,694 daily (weekday) riders compared with the 56,225 a day on the Blue Line LRT.
It should be noted that Line 60 partly acts as a feeder to the Blue Line, so its ridership is undoubtedly partly a function of ridership attracted to the Blue Line and its high level of service.
Line 60 currently [2001] requires a total of 115 daily bus-trips.