Light Rail Now/Light Rail Progress can be contacted at: Light Rail Now! |
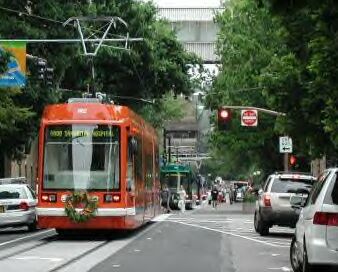
It's generally known that one of the advantages of light rail transit (LRT) is that it can be routed very flexibly, and, in particular, it can use available surface street and roadway space. However, the degree to which the array of different LRT systems use this type of routing varies significantly. The table below lists total route-mileage and the amounts and proportions in streets and arterials for the most modern-type LRT systems in North America. Modern LRT Use of Street and Arterial Right-of-Way
Sources: John Schumann, "Status of North American Light Rail Transit Systems", "8th Joint Conference on Light Rail Transit, Dallas, Nov. 2000; Portland Tribune, 18 June 2002"; M. Carter, Parsons Engineering, 25 July 2002; R. Eacker, Sound Transit, 25 July 2002; John Schumann, LTK Engineering, 25 July 2002; Houston Metro, 13 Jan. 2001; Central Phoenix/East Valley Light Rail Transit Project, 25 July 2002; Sound Transit, Tacoma Link, 27 July 2002. From the standpoint of a tendency over time, is there a perceptible trend toward either greater or less use of streets and arterials for LRT right-of-way? The following graph depicts the trend, timewise, in terms of the percentage of LRT alignments in streets and arterials for the newest systems (since 1978):
The data in the graphs seem to suggest a trend toward the greater use of streets and arterials as surface routes for LRT. Photo credit: M. Kavanaugh (Portland streetcar). Updated 2003/04/24 | ||||||||||||||||||||||||||||||||||||||||||||||||||||||||||||||||||||||||||||||||||||||||||||||||||||||||||||||||||||||||||||||||||||||||||||||||||||||||||||||||||||||||||||||||||||||||||||||||||||||||||||||||||