· "Bus Rapid Transit" Analyses · Political Campaigns for Light Rail Related Links
Light Rail Now/Light Rail Progress can be contacted at: Light Rail Now! |
Point ... Counterpoint This Weblog-style feature provides an ongoing forum for relating current and familiar claims and allegations – often in the category of Urban Legends – promulgated by rail transit opponents, and then fact-checking and responding to them from a pro-transit advocacy perspective. 18 September 2007
Minneapolis: Critics' Contentions: in their current ongoing insurgency against public transportation, critics of light rail transit (LRT) seem to be making a particular point of selecting for attack some of the most successful LRT operations in the USA. in a broadcast of 8 August 2007, extremist-rightwing radio "talk jock" Rush Limbaugh took aim at Minneapolis's Hiawatha light rail transit (LRT) system, calling it "a boondoggle of gigantic proportions" and claiming that "hardly anybody uses it...." Picking up the drumbeat of the current Road Warrior crusade to exploit the Minneapolis i-35W bridge collapse tragedy in order to sharpen their axe against the federal mass transit funding program (with the intention of funnelling transit money into ever more highway construction), Limbaugh ranted that "the money should have been used to rebuild bridges .... and save lives ...." Various transit critics and highway boosters have been making various anti-transit and anti-rail claims, often backed by the usual selective cherry-picking and manipulation of statistical "data" that has become their familiar stock in trade. This includes choosing just the right pair of years to compare performance data and declare a drop in performance. For example, one critic argues that a drop in passenger-mileage between 2001 and 2005 demonstrates that the Hiawatha LRT is a "failure". Response: One would have to go through considerable contortions of perception to assert that Minneapolis's Hiawatha LRT line in anything but a major transit success. Obviously, some of these contortions including (a) selecting a "trend period" carefully cherry-picked to highlight an ostensible "ridership decline", and (b) starting the trend line several years before the start of LRT operations, while assigning responsibility for the entire performance trend to LRT. First of all, prior to the launch of LRT (which, despite being a single line, now carries a substantial proportion of system ridership) ridership in the Twin Cities of Minneapolis-St. Paul was in significant decline. The following tabulation of annual ridership from the Twin cities Metropolitan Council clearly shows this downward trend, which persisted into a severe bus workers' strike in 2004 and the partial opening of LRT in that year. Subsequently, after the advent of LRT, it's obvious that ridership has resurged.
Twin Cities Transit Ridership
Regarding recent trends in ridership, the Met Council's 2005 Transportation System Audit makes the following points:
Twin Cities transit advocate John DeWitt adds the observation that
John also notes that "The Minnesota legislature has cut transit funding in four out of the last five years." A clearer picture of the impact of the Hiawatha LRT on Metro's ridership can be obtained by considering passenger-miles. Here’s the record of passenger-mileage just before LRT opened through 2005:
Total Transit Passenger-Miles
By this measure of ridership, LRT has clearly helped increase Twin Cities total transit ridership significantly. Contrary to what rail critics have been straining to claim, whatever decline in ridership did occur had nothing to do with LRT and everything to do with the factors that have been delineated above, including the damaging 2004 bus drivers strike. Most significantly, it is evident that ridership, measured both in rider-trips and passenger-miles, has surged since the introduction of LRT service in mid-2004. Light Rail Now! Point ... Counterpoint URL: http://www.lightrailnow.org/myths/m_pointlog2007q1.htm#MiN_20070918 Updated 2007/09/18 28 April 2007
Portland: Claim: Rail opponents occasionally acknowledge that some rail systems may have lower ongoing operating & maintenance (O&M) costs than comparable bus services, or the previous bus services they replace. But, they argue, these cost savings are far outweighted by supposedly enormous capital investment costs of rail systems. Response: The higher capital costs of rail are usually balanced or exceeded by savings in the O&M cost of previous (or comparative) bus services and other, additional, benefits associated with the rail installation. it's important to fully understand the dramatic and qualitative difference between ongoing operating & maintenance (O&M) costs and capital costs. When one purchases, say, a more fuel-efficient motor vehicle, part of a rational decisionmaking process is to analyze how much you'd save in ongoing fuel costs over the life of the car. That might not pay for the entire cost of the car, but it could make a difference in evaluating the capital investment vs. that of another model. In major transit investments, the annualized (or amortized) capital costs are figured into the overall economic analysis; these may be all or partly offset by savings in O&M costs. As a general rule, at and above a certain volume of traffic, rail transit systems tend to provide transport at significantly lower operating & maintenance O&M cost per passenger-mile (passenger-km) than buses. This is an important offset against the typically higher cost of rail transit capital investment. Also, one must figure in benefits such as time savings (or, conversely, disbenefits such as time liabilities), adjacent economic impacts, and macro-scale and longterm benefits in areas such as public health and safety and more comprehensive community development goals. The entire mix of costs and benefits is used comparatively to determine the feasibility of major transit investments. Several studies have shown that the adjacent new development attracted around Washington Metro stations has generated new real estate investment and tax revenues more than offsetting the publicly assumed annualized capital costs of the system. Similar studies may have been performed for other rail systems. Finding suitable examples to illustrate this is somewhat challenging – particularly because new rail lines tend to meander over several different corridors (thus opening new travel corridor patterns), and it's difficult to pin down the data for a reasonably comparable bus service corridor. However, Portland's new MAX light rail transit (LRT) Yellow Line on Interstate Ave. offers an opportunity for at least a reasonable "horseback" estimate of benefits, since it has generally replaced the previous 5-Interstate bus route. The Yellow Line LRT was completed and opened in 2004 – spanning 5.8 miles at a cost of $350 million. National Transit Database (NTD) data for 2004 can be used for this analysis, with monetary values expressed in 2004 dollars for convenience. • General assumptions: Because of the character of the service, this analysis estimates average trip length (ATL) at 4 miles. Recent reports indicate ridership of just over 12,000 weekday trips; this analysis uses 12,000 as the basis ridership. The annual:weekday ratio is 320. • Transit operational savings: Details such as train vehicle-hours and previous bus-hours for the period in question were not available for this analysis. However, reasonable estimates of key cost elements have been made. We'll start by estimating passenger-mileage and then O&M cost savings based on the known average differential between TriMet bus and LRT services.
On average, the Portland LRT's O&M cost is $0.45 less (2004) than that of bus service. Thus...
in other words, the savings in transit operating cost over bus service ($345 million) almost equals the capital cost of the Yellow Line LRT project ($350 million). In fact, the margin of error in this analysis is probably such that one can say they're just about equal, and the operating cost savings have basically "paid" for the capital cost of the project. • Transit user savings: However, in addition to these direct savings in transit operations, the Yellow Line LRT has rendered additional important monetary benefits that further offset the capital investment expense. For example, there are time savings for previous transit users. This analysis has used $7.00/hour as the value of time (about 12 cents per minute). The new Yellow Line LRT service has an average speed of about 18 mph. It is plausible to assume that the previous 5-Interstate bus line averaged 14 mph – a 4 mph saving. For the 4-mile ATL, this comes to a saving of 1.5 min/trip, or $0.18/trip. The Yellow line LRT has nearly doubled ridership – a factor of 1.95 is reasonable. From this, a breakdown of ridership can be calculated as 6,200 previous transit rider-trips and 5,800 new trips. The 6,200 previous trips equate to 1,984,000 per year. Then, 1,984,000 X $0.18 = about $347,000 saved per year, or $17.9 million over the life of the project. • Motor vehicle trip diversion savings: But there's more. Of the 5,800 totally new trips, this analysis assumes 67% are previous auto drivers, and of these, 80% were travelling to/from Portland's CBD – roughly 3,100 trips, or about 1,500 motor vehicles that no longer need accommodation in the CBD. The savings in parking can be estimated. Almost all new CBD parking now is in the form of parking garage spaces, which cost approximately $15,000 each. So saving 1,500 spaces (because of 1,500 fewer vehicles) represents a cost saving to the Portland community of about $22.5 million. Furthermore, the Yellow Line LRT, by diverting about 3,900 daily motor vehicle trips off the roadway and onto the transit line, has averted the need to widen Interstate Ave. to accommodate that many trips – this analysis assumes a lane in each direction. For an inner-city major arterial, including real estate acquisition, that probably would come to about $20 million per mile, and the diverted cost of additional roadway would be substantial:
• Total benefits exceed capital cost: This, being a "horseback" estimate of economic impacts, is far from comprehensive, and there are various other benefits which are more complicated to estimate than this kind of rough assessment justifies – for example, adjacent transit-oriented development (TOD) value and increased tax base, motor vehicle operating cost savings, time savings for other transit users, etc. Nevertheless, the total of benefits is substantial:
And for this tremendous economic benefit, Portland also has a far nicer, cleaner, quieter, safer means of mobility in this corridor. The Yellow Line LRT has improved urban livability for both residents and visitors in the corridor, and is already helping stimulate economic revitalization. 27 March 2007
London: Claim: in a recent diatribe against publicly supported urban mass transit, highway industry ideologue and publicist Wendell Cox Cox cites data from London to hone his familiar axe against publicly supported transit and on behalf of private-profit transit operation (some of his major contributors are private bus companies). This is promoted under the rubric of "competitive bidding" (or "tendering") – i.e., transit agencies' out-sourcing contractual operation of public transit operations, rather than operating such services directly with agency employees. According to Cox, "Around the world, the competitive market has been employed to substantially reduce unit costs and increase service levels."
in Cox's view, "Substantial benefits have been achieved" by similar out-sourcing programs in Stockholm and other major cities, and this has resulted in reducing ongoing costs and at the same time tremendously improving transit services for the public. Response: Proponents of the "miracle" of privatization selectively present information to make it sound like somebody has turned water to wine in the public transit industry. However, the actual facts of private-sector involvement in public transport operations are considerably more complex, and the results much less clear-cut, than Cox portrays. British public transport expert and advocate Mike Taplin addresses Cox's claims with respect to London's public transport operations:
Finnish transit advocate Lauri Pitkänen comments that a public-private model similar to that of London "is in use in all of Sweden including Stockholm and here in Helsinki in Finland."
According to Pitkänen, Cox's arguments that "privatization" (out-sourcing of operations) has produced a significant modal shift from private motor vehicles to public transit are without merit. instead, major investments in urban transit and upgrading of operations are major factors which have begun to attract more ridership.
in assessing this information, and the possible application of the European "franchise" model to North America, we would recommend that urban transit planners and decisionmakers would do well to consider the following issues:
12 March 2007
Boston: Claim:
The most vociferous adversaries of urban rail transit investments argue that public funding of such projects is a shocking waste, and
should be instead diverted into more and much larger roadway investments.
According to these rail opponents, urban travel by transit, compared to the regional whole, is so minuscule as to be irrelevant (and therefore wasteful).
investments in major transit improvement projects, like the light rail new-start projects now under way in Phoenix and Charlotte, are relentlessly attacked as a squandering of public money (because they supposedly will carry only a tiny share of total regional travel).
Major highway projects, these rail transit critics assert, are far more relevant and valuable investments.
Response: in responding to these kinds of arguments, the basic fallacy of comparing the ridership of rail transit lines – which predominantly serve individual corridors – to the travel throughout a huge urban region should first be pointed out. As we explain in our article Debunking the "Costs Too Much, Does Too Little" Myth, "the percentages commonly apply to a metropolitan region of which only a portion (often relatively small) is typically even in the transit agency's service area. So transit is being disparaged for not carrying trips in places it doesn't even serve!" This article also points out that
But if investment in individual transit facilities, such as rail lines, can be disparaged – then, by the same measure, so could major investments in roadway facilities. The Boston area offers an excellent case in point. Boston's "Big Dig" (Central Artery) interstate highway tunnel project cost a whopping $14.6 billion (that's billion with a B) for about 8 miles. it carries approximately 200,000 vehicle-trips a day. Assuming all these vehicles travel the full 8 miles, with an average occupancy of 1.6 persons, that's about 2.6 million passenger-miles a day – and includes both local, commute-type trips as well as lots of through, intercity trips (so they're not readily comparable to Boston's local mass transit). According to the latest study (2005) from the Texas Transportation institute, the Boston urban area experiences about 90 million vehicle-miles/day, or roughly 144 million person-miles (using the average occupancy shown above). Thus the "Big Dig" project carries only 2.6/144 = a "puny" 1.8% of total urban area road traffic! And for a nearly $15 billion investment! Yet this project – far from being denounced for this ostensibly minuscule travel impact (and in stark contrast to the incessant denunciation of rail and mass transit) – has been widely hailed and favorably cited by the Road Warrior community ... including Wendell Cox (a major advocate of urban roadway tunnels as a "solution" for congestion and alternative to public transport investment). The basic point is that transportation investments vary widely in cost, efficacy, validity, and other respects. Massively expensive investments (like tunnels and bridges) may seem minuscule compared to the region as a whole – but may be assessed to have absolutely critical value and impact for a relatively tiny area or corridor. Rail transit, including light rail, is no exception. 29 January 2007
Dallas: Claim:
A major ridership record hit last year by Dallas's light rail transit (LRT) system holds little benefit, in the view of opponents of rail transit.
According to a Dallas News article (23 April 2006) cited by transit advocates, DART (Dallas Area Rapid Transit, Dallas's transit agency) "carried the most passengers in its history for the Mega March in downtown Dallas on [Sunday] April 9."
DART recorded 90,000 trips on light rail and 51,569 trips by bus.
According to the article, "On a typical Sunday, the agency records about 18,000 light-rail trips and 35,900 bus trips.
The light-rail total easily eclipses DART's previous record of 75,000 trips." However, rail opponents disparage impressive ridership figures like these. According to one transit critic, "there were likely somewhere between 14,000,000 to 16,000,000 trips per day in the MSA [metropolitan statistical area] area of DFW [Dallas-Ft. Worth] last year [2005]. So, 140,000 trips might be as much as only 1% of daily trips." By this measure, it's claimed, Dallas's light rail is supposedly insignificant and nearly worthless as a mobility investment. The news article also relates that DART collected approximately $93,000 for carrying those nearly 152,000 trips – calculating to about 66 cents per rider-trip, above the system's average of 59 cents. Rail critics use this information to claim that this indicates LRT is supposedly costlier: "Some of these [trips] are by folks that are transit dependent. Most are probably on the [approximately] third of those transit trips that are by bus. We also learn in this article that the average fare collected is in the range of 60 cents per trip. So the significantly high costs of the LRT are eating up the funds available to provide more service to those who depend on transit." Response: This is a typical Straw Man argument used by rail transit critics which attempts to downplay the significance of strong ridership on a rail transit line by comparing it with an arbitrarily selected much larger total. in reality, the volume of total areawide trips, in comparison to a relatively short transit route, in any urban area is utterly irrelevant. For Dallas, why not throw in all trips in North Texas, the entire state of Texas, or perhaps North America? it's also important to keep in mind that all these regionwide trips include trips to the convenience store to buy the Sunday paper, trips to the carwash, trips over to church, etc. – in other words, trips that are really not likely to be served by the single transit route being disparaged. Let's look at the 90,000 rider-trip figure on DART's light rail system another way. There are about 283,000 people residing in the LRT service area (assuming an average of 1 mile either side of the line). The 90,000 trips were probably made by about 40-45,000 individual travellers. That's a volume of passengers equal to about 14-16% of the people resident in the corridor area served – on that single transit line – and on a Sunday! if all those people had piled into private motor vehicles – as the Road Warriors would really recommend as their preferred alternative – that would amount to about 35,000 to 38,000 additional motor vehicles added into Dallas's Traffic Meatgrinder, and almost all trying to cram into downtown Dallas (and compete for scarce parking spaces). To call that a nightmare is an understatement. Meanwhile, what about the Road Warriors' fallback transit alternative – buses? DART's bus system – which serves the entire DART service area (population 2.2 million), not just a relatively narrow corridor, carried a comparatively "light" 52,000 trips – slightly more than 2% of the total bus service area. Perhaps this proportion would become slightly larger if each route were evaluated according to the "one-mile" corridor criterion used above for LRT. in addition, there undoubtedly were several heavier bus routes feeding into downtown which carried substantially higher loads than the areawide average, amounting to a higher proportion of their corridor service area populations. While it's doubtful that any bus routes equalled or exceeded the proportion carried by the LRT, nevertheless, it's likely that the overall impact of DART's transit ridership was substantially more significant than the critics' comparison with amorphous, regionwide travel would suggest. With regard to rail critics' claims that the higher revenue per rider-trip demonstrates that LRT is slighting transit-dependent riders, this clearly has no basis in an average reflecting both bus and LRT revenues. Furthermore, according to the Federal Transit Administration's 2004 National Transit Database, DART's LRT carried its ridership at $0.47 per passenger-mile compared with $0.86 on the bus system. in other words, far from "eating up funds", DART's LRT is saving the system approximately 45% below the unit cost of bus system operations to transport passengers. it's that kind of real efficiency that enables transit systems in Dallas, Portland, St. Louis, and many other places with rail to expand their overall transit services, for both transit-dependents and choice riders alike. Light Rail Now! website | ||||||||||||||
|
|
|||||||||||||||
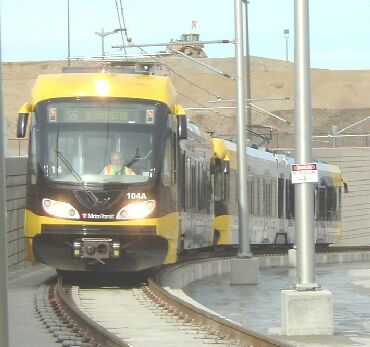 Minneapolis light rail